
Cosmos’s native token ATOM has surged more than 38 percent in the last five days, validating a textbook technical indicator that now predicts additional 70 percent gains for the cryptocurrency.
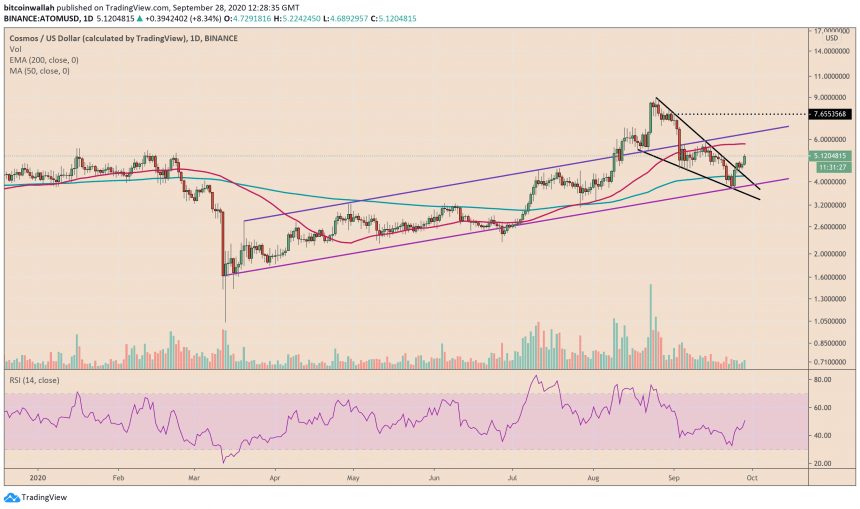
ATOMUSD breaks out of its Falling Wedge pattern. Source: TradingView.com
As shown in the chart below, ATOM/USD was trading inside a Falling Wedge pattern, confirmed by its price fluctuating downwards between two converging trendlines. On September 24, the pair rebounded from the pattern’s lower trendline to close above the upper one.
Breakout Outlook
ATOM/USD continued on its uptrend upon breaking the Wedge’s resistance trendline. On Monday, the pair added another 8.5 percent to its rally, bringing its net rebound up by 38 percent. It was trading at $5.12 at the time of this writing.


A Falling Wedge is a bullish indicator. According to its textbook definition, an asset trending inside the said pattern eventually breaks out to the upside. The breakout target, in this case, is as much as the maximum height of
Related Posts

Financial Advisors Reluctant to Discuss Crypto with Clients Due to Legal Concerns, Survey Finds
Financial Advisors Reluctant to Discuss Crypto with Clients Due to Legal Concerns, Survey Finds Ruholamin Haqshanas Last updated: May 13,...

EigenLayer Launches EIGEN Token Airdrop, Tokens Remain Non-Transferable
EigenLayer Launches EIGEN Token Airdrop, Tokens Remain Non-Transferable Ruholamin Haqshanas Last updated: May 11, 2024 05:11 EDT | 2 min...

SEC Delays Decision on Invesco Galaxy Spot Ethereum ETF
SEC Delays Decision on Invesco Galaxy Spot Ethereum ETF Tanzeel Akhtar Last updated: May 7, 2024 01:32 EDT | 1...

Polygon Launches Alpha Testnet of Zero-Knowledge Rollup Solution ‘Miden’
Polygon Launches Alpha Testnet of Zero-Knowledge Rollup Solution ‘Miden’ Ruholamin Haqshanas Last updated: May 7, 2024 03:27 EDT | 2...

Ethernity Switches to AI Enhanced Ethereum Layer 2 to Prevent Counterfeit Asset Trading
Ethernity Switches to AI Enhanced Ethereum Layer 2 to Prevent Counterfeit Asset Trading Tanzeel Akhtar Last updated: May 7, 2024...


Discussion about this post