
- It appears Bitcoin missed a medium-term upside target above $11,500 after undergoing a significant sell-off in March 2020.
- The major northward move had appeared out of a Falling Wedge breakout.
- Bitcoin reentered the Wedge after the crash and followed it with a breakout towards a new bull target near $9,500.
- The cryptocurrency is still eyeing $11,500.
Bitcoin is sending a buy signal.
So shows a textbook technical indicator called Falling Wedge. The chart pattern started forming after Bitcoin surged to near $14,000 in June 2019. As the cryptocurrency started correcting lower afterward, it left behind converging lower highs and lower lows, as shown in the chart below.
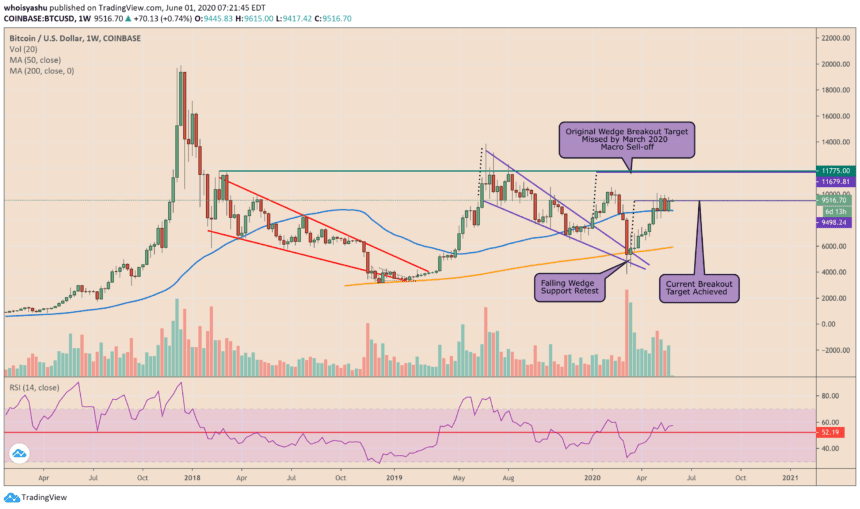
BTCUSD formed a Falling Wedge pattern after topping in June 2019 | Source: TradingView.com, Coinbase
The purple downward slope shows the Wedge that Bitcoin broke successfully to the upside in the first week of January 2020.
Ideally, the price could have blasted towards $11,679 per a Falling Wedge’s technical description. The definition reads that a successful Wedge breakout would rise by as much as the height between the pattern’s highest high and highest low. That is represented via the purple dotted lines in the chart above.
Global Market Sell-off
But Bitcoin’s upside run met resistance with a surprising global market sell-off in February and March 2020. As a pandemic loomed over the world and sent people in self-inflicted lockdowns, the business activity collapsed. Investors reacted and caused a global market rout. Everything fell in tandem, including Bitcoin.
The cryptocurrency fell by more than 63 percent, from its YTD top of $10,500 to a new low at $3,858. But the fall brought it back inside the Rising Wedge region.

BTCUSD retested the Falling Wedge support in mid-March | Source: TradingView.com, Coinbase
Bitcoin retested the Wedge support, followed by a sharp rebound that broke the pattern’s resistance. The move confirmed the second breakout out of what appeared like a restored Falling Wedge, with its new upside target set near $9,500.
In the first week of May, Bitcoin broke above $9,500. The cryptocurrency has since flirted with the level as its flipping support/resistance junction.
Completing an Unfinished Bitcoin Rally
Traders would have achieved the $11,500 price target had there been no global market sell-off.
Bitcoin was rising on the cusp of increasing geopolitical tensions between the U.S. and Iran and uncertain aftermath of the trade deal between the U.S. and China. Its technical indicators have also alerted a bullish signal, which included the formation of a Golden Cross on daily charts in February.
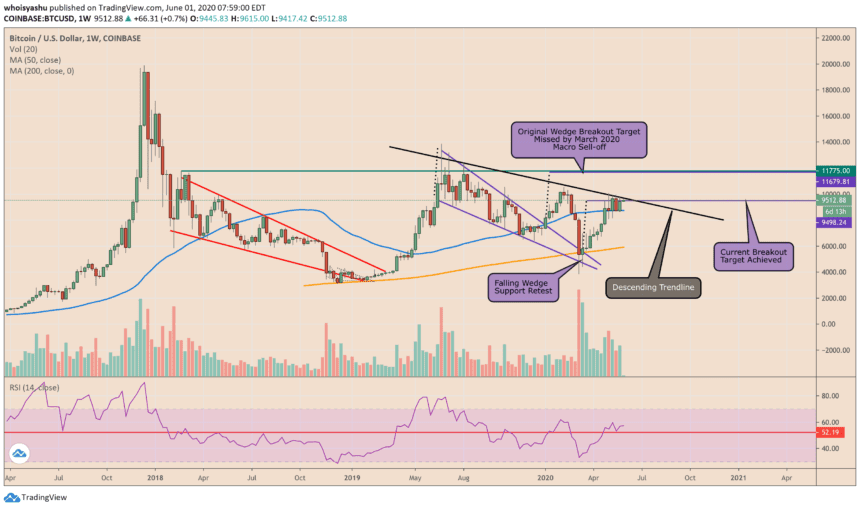
BTCUSD Descending Trendline resistance | Source: TradingView.com, Coinbase
With the sell-off in rearview, and all the wounded assets recovering impressively, Bitcoin, too, is gaining back its pre-March 2020 sentiment. The cryptocurrency in May formed yet