
With Bitcoin holding strong above $10,000, the halving in the past, and months of positive price action, it is hard to not be bullish on the first-ever cryptocurrency.
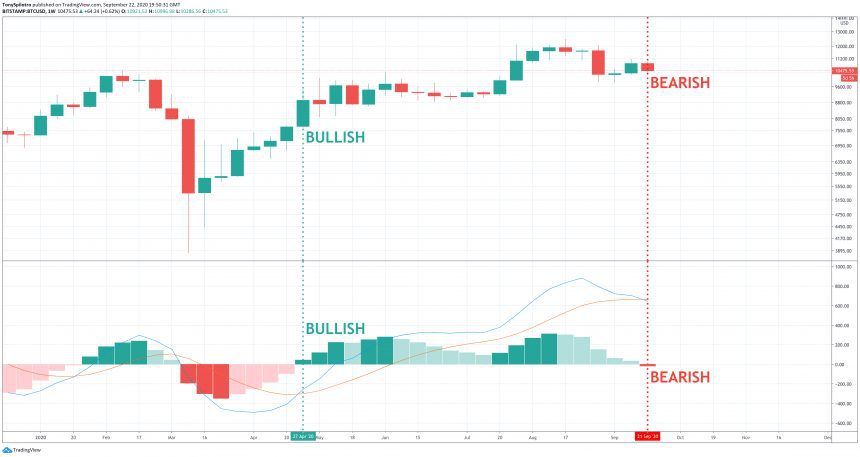
However, a momentum measuring tool has flipped bearish for the first time since April 2020 on weekly timeframes, potentially pointing to $10,000 failing to hold and a deeper correction ahead. Here’s what the technical analysis tool is saying and what has resulted from past bearish crossovers of the MACD.
What is The MACD And Why Is It Flipping Bearish Bad For Bitcoin?
The Moving Average Convergence Divergence indicator is a technical analysis tool used in Bitcoin price charting that serves a variety of functions.
The further the two moving averages diverge, the more overbought or oversold an asset is. When the two lines crossover, it can signal that momentum is turning either bullish or bearish.
In addition to the two moving averages, most MACD indicators feature a histogram to more clearly visually represent changes in momentum. The tool, while effective and extremely popular, is often regarded as a lagging indicator.
Related Content