Bitcoin’s defense of key long-term support for the second time in four days is a positive sign for a potential recovery rally.
The leading cryptocurrency by market value fell below $4,242 (low of Wednesday’s inside-day candle) in the Asian trading hours, putting the bears back into the driver’s seat. As a result, BTC fell below the 200-week exponential moving average (EMA) of $4,182 earlier today.
The breach of the EMA support, however, may have trapped the bears on the wrong side of the market, as BTC is currently trading at $4,330 on Bitstamp, having clocked an intraday low of $4,061 earlier today.
It is worth noting that the long-term EMA was first breached on Tuesday. The subsequent sell-off, however, ended at the 14-month low of $4,048 and prices recovered to $4,500 on the following day.
The repeated failure to beat the long-term support indicates the bears have likely run out of steam. As a result, a stronger corrective rally could be in the offing.
4-hour chart
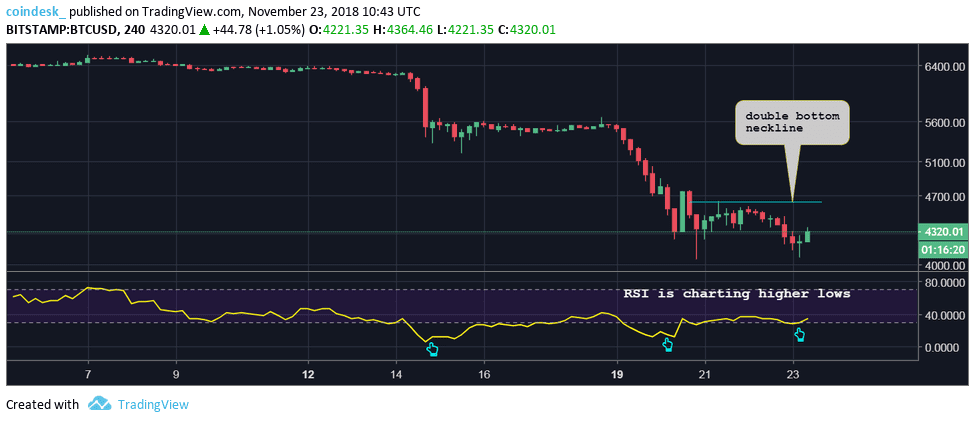
On the 4-hour chart, the relative strength index (RSI) has created a bullish divergence with higher lows.
As a result, BTC looks set to test $4,635 – the neckline of the double-bottom bullish reversal pattern. A break above that, if confirmed, would open up upside toward $5,100 (target as per the measured height method).
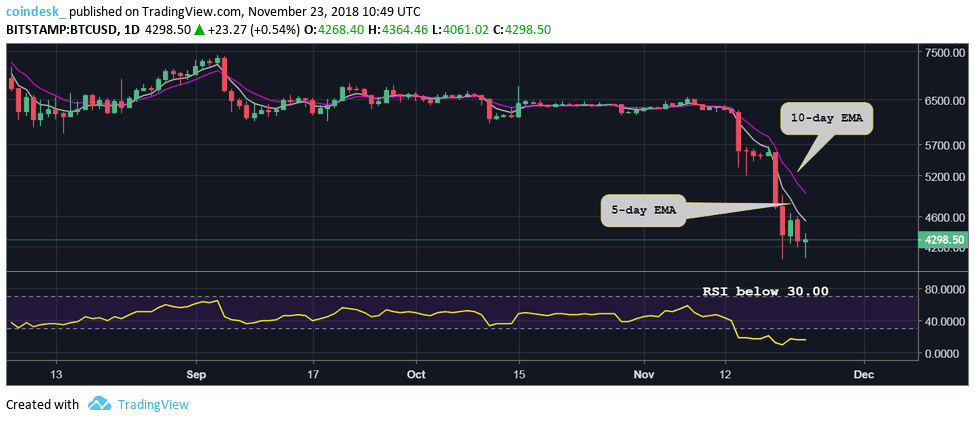
Daily chart