
The entire crypto space has been on fire lately, causing most investors and analysts across the market to conclude that Bitcoin is just days away from entering its next bull market, ready to reach new all-time high prices.
But the most recent rally may now be over, and according to a year-long trendline, the latest move up may have been nothing more than a bearish retest confirming the 2019 uptrend as support now turned resistance before a shocking fall further.
Is a Crypto Bull Market Back On?
Ever since the start of 2020, Bitcoin has been rallying, bringing investors over 30% on year-to-date returns. Elsewhere across the crypto market, altcoins have also been skyrocketing, causing a return of investor confidence in the asset class.
Indicators on monthly and weekly timeframes all show signals that Bitcoin is soon entering a bull market.
Related Reading | Bitcoin Just Formed a Golden Cross, Restoring Faith in A Crypto Bull Run
And while there may be truth to that theory, a one-year-long trendline dating back to Bitcoin’s bear market bottom could have just acted as a confirmation of support turned resistance.
Bitcoin in late December 2018, met its bottom at roughly $3,100. It wasn’t until early February, when Bitcoin made another retest of lows, that after support held, caused the crypto asset to take off on a parabolic rally toward $14,000.
But that rally topped out, and Bitcoin entered a six-month downtrend, that many now believe to be behind us.
However, the breakdown in mid-November was able to breach below the former 2019 uptrend line, before falling to current local lows around $6,400.
It was those lows that acted as a launchpad for the most recent rally.
But the rally may have just concluded with a retest of that year-long parabolic uptrend line, dating back almost exactly one year to the start of February.
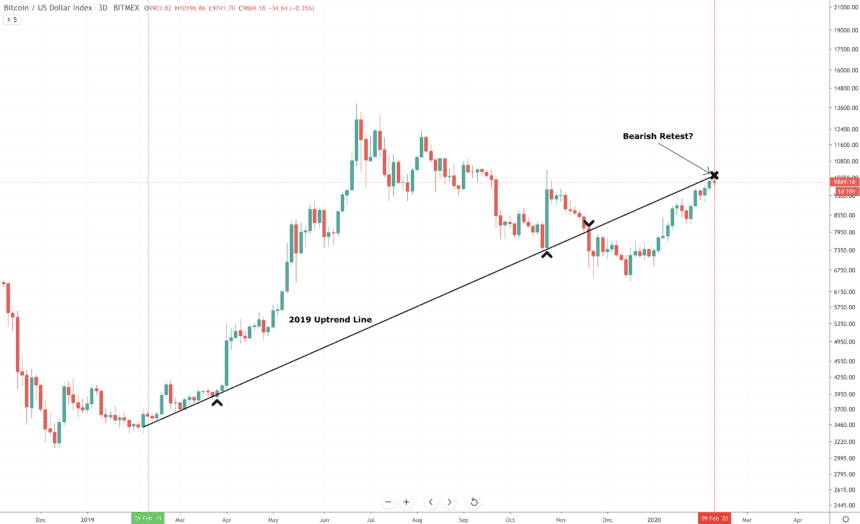
Bitcoin Bearish Retest of Year-Long Trendline Could Spell Disaster Ahead
As can be seen on the price chart, the retest of the bottom support and the retest of the uptrend line as support turned resistance are precisely a year apart.
The trend line acting as support turned resistance doesn’t necessarily mean Bitcoin cannot get back above it, but it does show that there’s potential here to stop the current rally in its tracks.
Bitcoin only broke below the important trend line after three touches, so it may require additional attempts by the leading cryptocurrency by market cap to break back above the line – if it is able to do so at all.
Related Reading | Bitcoin is Setting Up For a Violent Long Squeeze, Which May Trigger New Lows
And staying below the trendline doesn’t necessarily mean that Bitcoin can’t enter a new bull market, it just means that the trajectory to get there may be a little less steep and take a bit