
It has been five days since the Bitcoin Cash fork began and crippled the stability of the BCH ecosystem, and the worst part is that it is not looking to recover anytime soon.
The BCH/USD pair on Tuesday dropped another 40 percent — on paper, anyway (most exchanges paused BCH trading ahead of the fork and are consequently seeing all of the recent market losses realized at once) — setting new yearly lows at 237.14-fiat. There were no signs of upside recoveries that could stand for long. The downtrend intensified as each session formed bearish flags and pennants consecutively. The continuation pattern started to indicate more breakdowns. And as they happened, the BCH/USD pair went inside a free fall without finding a bottom.
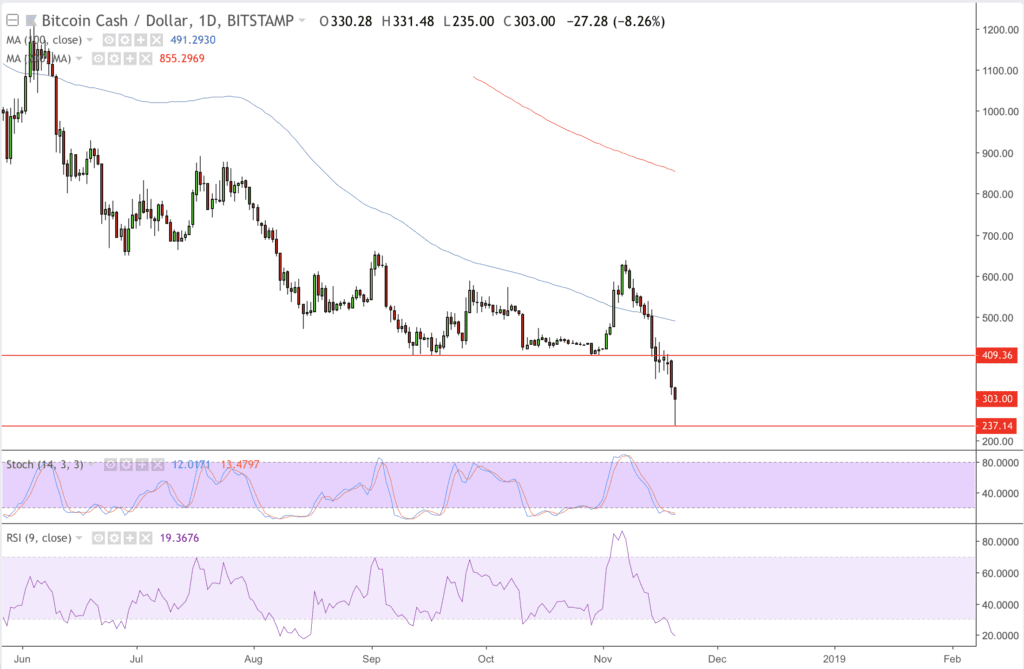
BCH/USD 1D CHART | SOURCE: BITSTAMP, TRADINGVIEW.COM
BCH/USD has invalidated its neckline level at 409.36-fiat on Bitstamp, a level which is now stronger as resistance that it was as support. The pair has established an intraday support at its year low at 237.14. There is a little recovery in the making, but that could be nothing but yet another bear pennant forming, as discussed above. As the daily chart points to a downside action, its RSI has already dipped inside an oversold territory. The same is visible in the Stochastic Oscillator trend, which is way inside its oversold region as well.
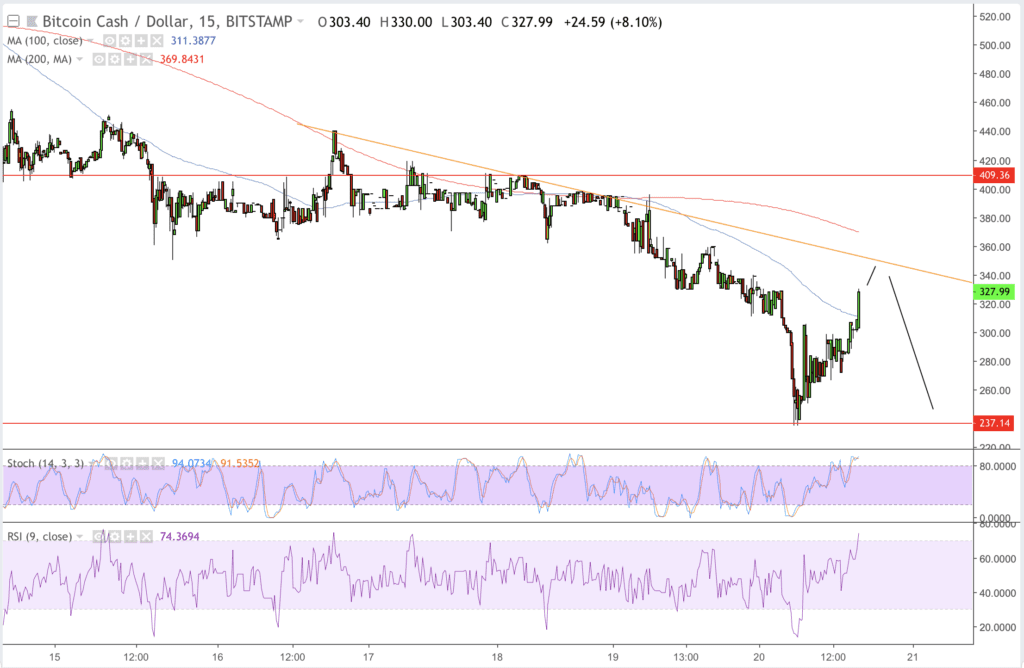
BCH/USD 15M CHART | SOURCE: BITSTAMP, TRADINGVIEW.COM
The interim price action in the BCH/USD chart shows RSI and Stochastic in overbought territory already. A resistance trendline in orange is capping the upside movements as of now. With a likelihood of high selling pressure around the said level, BCH/USD can complete its pennant formation to form yet another bearish flag, retesting 237.14-fiat as newfound support.
In a longer-term (1W), however, the BCH/USD pair is falling towards nowhere. There is no bottom in sight, allowing bears to drive the market as low as they want. Concerning RSI and Stochastic, the weekly chart is still trending inside the selling area, awaiting correction.