
View
- Bitcoin closed the first quarter of 2017 with 10.91 percent gains – the biggest quarterly gain since the fourth quarter of 2017.
- While bearish exhaustion is evident, a bullish reversal above $4,236 still remains elusive. A sustained break above that level may not happen in the next few months, as the price seems to be mimicking the bottoming pattern seen in nine months leading up to the October 2015 bull breakout.
- Bitcoin’s short-term outlook remains bullish as Friday’s close above $4,055 bolstered the bullish setup on the daily chart. The cryptocurrency could test the February high of $4,190 this week.
- However, a persistent failure to clear $4,130 – the high of a doji candle created on Saturday – may invite selling pressure and yield a drop to the crucial 30-day moving average, currently at $3,938.
Bitcoin made double-digit gains in the first three months of 2019, marking its best quarterly performance since Q4 2017.
The crypto market leader closed (UTC) yesterday at $4,096, representing a 10.91 percent gain on January’s opening price of $3,693, according to Bitstamp data.
That is the first double-digit quarterly gain since the final three months of 2017 when prices had rallied a staggering 220.84 percent.
Back then, the bull market was raging on hopes that listing of bitcoin futures on major US exchanges would open the doors to the yield-hungry institutional investors. That, however, did not materialize and prices fell by 73.39 percent in 2018.
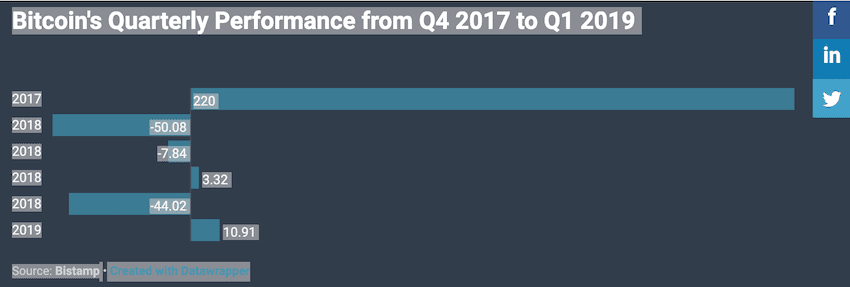
As can be seen, the latest double-digit quarterly gain has come after a prolonged bear market but looks more than the usual corrective bounce with prices mimicking the bottoming pattern seen before the 2015 bull breakout.
Further, a closer look at the monthly price action indicates the cryptocurrency is likely making a slow transition from a bearish to a bullish market.
January: Seller exhaustion
Bitcoin fell 7.59 percent in January, but the monthly high and low fell within the trading range of the previous month. Essentially, BTC created “an inside month” candle, a sign of bearish exhaustion.
February and March: Higher lows
BTC established a bullish higher low near $3,300 on the weekly chart in the first week of February and jumped to a high of $4,190 on Feb. 24.
The rise above $4,000, however, was short-lived and prices fell back to 3,600 at the end of February. BTC had charted its way back to $4,100 by the end of March with multiple bullish higher lows along the 30-day moving average.
The bearish exhaustion followed by a steady stream of higher lows has raised hopes of BTC confirming a bull breakout with a move above $4,236 (Dec. 24 high).
However, if history is any guide, then a sustained break above $4,236 may not happen for a few more months. It is worth noting that the bullish breakout seen in October 2015 was preceded by a nine-month period of consolidation.
In the short-term, the path of least resistance appears to be on the higher side. As of writing, the cryptocurrency is changing hands at $4,122 on Bistamp – up 0.82 percent on a 24-hour basis.
Weekly and daily chart
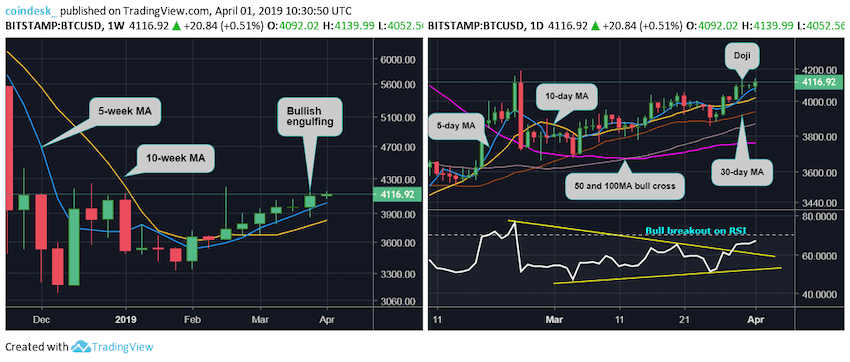
As seen on the weekly chart (above left), BTC created a bullish engulfing candle last week, reinforcing the bullish view put forward by the ascending 5- and 10-week moving averages (MAs).
On the daily chart (above right), BTC created a bullish higher low along the 30-day MA on March 25 and closed well above $4,055 on Friday. That strengthened the bullish case put forward by the upward sloping 5- and 10-day MAs, the bullish crossover of the 50- and 100-day MAs and the long-tailed doji created on Feb. 27.
As a result, BTC look set to test the Feb. 24 high of $4,190.