
- Bitcoin is correcting lower after testing $10,000 as its local top.
- But a confluence of technical and fundamental catalysts could flip the cryptocurrency’s direction towards $11,000.
- They include a Symmetrical Triangle formation, the Sino-U.S. geopolitical conflict, and the Federal Reserve’s unlimited fiscal support.
Bitcoin is correcting lower in the final week of May but its likelihood of retesting levels above $11,000 is growing higher next month.
That is, according to Symmetrical Triangle, a technical chart pattern wherein the slope of the asset’s highs and lows converge together to meet at an apex. The textbook model also reflects traders’ uncertainty, for neither buyers nor sellers push the price far enough to establish an interim trend.
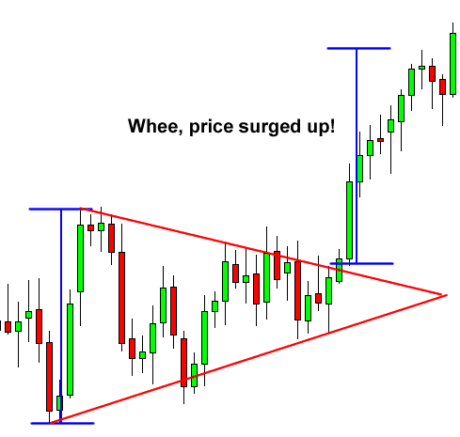
Symmetrical Triangle breakout illustration | Source: Babypips


Bitcoin has entered a similar chart pattern recently. The cryptocurrency on May 7 topped near $10,000 but quickly corrected lower towards $8,106. From there, it kept on making new lower highs and higher lows, giving the price action the look of a Symmetrical Triangle, as shown in the chart below.

At its current position, Bitcoin is correcting lower after testing the Triangle Resistance. Traders are not able to move prices neither below the lower trendline nor above the upper trendline. As these two slopes move closer, it means bitcoin could undergo a breakout to define its next directional bias.
Bitcoin at $11,368
Ideally, Bitcoin should break out in the direction of its previous trend since the Symmetrical Triangle indicators are mostly continuation patterns. Also, the upside move should extend by as much as the height of the triangle. As of now, the height of the Bitcoin’s triangle is just shy of $2,000.
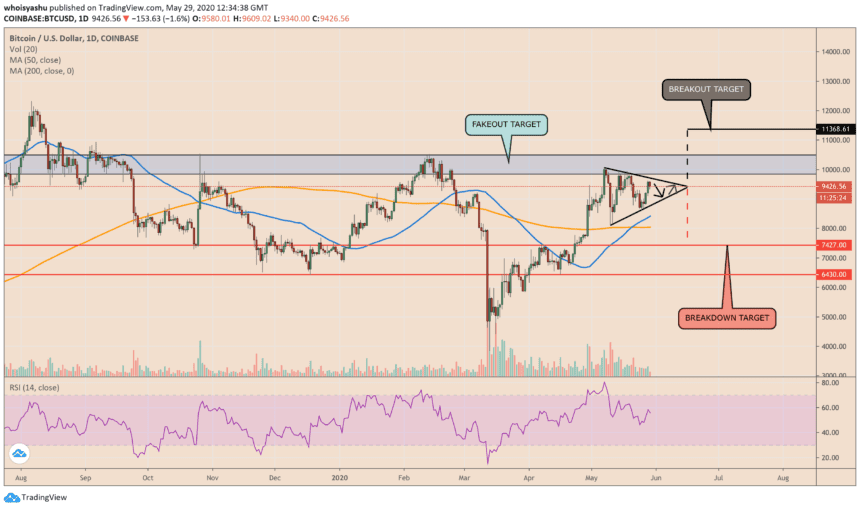
BTCUSD trending sideways in a Symmetrical Triangle | Source: TradingView.com, Coinbase
The price will reach the Triangle’s apex by mid-June 2020. Thereon, it may break above the consolidation area and fix its target towards $11,368. It is the same level that, in August 2019, capped Bitcoin’s upside attempts.
Nevertheless, closing above $11,000 would mean breaking bullish on Bitcoin’s long-term resistance trendline, as shown in the chart below.

BTCUSD shows bias-conflict near $9.5K | Source: TradingView.com, Coinbase
The battle could lead bitcoin into a so-called ‘Fakeout Target’ – the bluish area. It served as a crucial resistance in stopping the cryptocurrency’s moves above $10,500 in February 2020. Bitcoin’s likelihood of hitting $11,368 will increase if its breaks above the stubborn price ceiling.
Bearish Scenario
Bitcoin could also correct lower if it fails to garner adequate buying momentum near Triangle’s upper trendline. That would mean a retest of the lower trendline, followed by a breakdown towards $7,427.
That negative breakout looks certain on more extensive timeframe charts as well, as shown via bitcoin’s weekly graph below.
Related Posts

Bitcoin, Surf & My Crackdown on Gangs Bringing More Tourists than Ever to El Salvador, Says Bukele
Bitcoin, Surf & My Crackdown on Gangs Bringing More Tourists than Ever to El Salvador, Says Bukele Tim Alper Last...

Bitcoin and Ethereum Consolidate, ZEC and CEL Rally
Bitcoin and Ethereum Consolidate, ZEC and CEL Rally Aayush Jindal Last updated: June 26, 2023 06:54 EDT | 2 min...

Galaxy Digital’s Novogratz Doubts Bitcoin Will Pass USD 30,000 Barrier Soon
Galaxy Digital’s Novogratz Doubts Bitcoin Will Pass USD 30,000 Barrier Soon Jaroslaw Adamowski Last updated: October 19, 2023 12:23 EDT...

Bitcoin and Ethereum Gain Bearish Momentum, Altcoins Slide
Bitcoin and Ethereum Gain Bearish Momentum, Altcoins Slide Aayush Jindal Last updated: June 26, 2023 06:54 EDT | 2 min...

Crypto Turmoil Latest: Nuri Files for Insolvency while CoinFlex Files for Restructuring
Crypto Turmoil Latest: Nuri Files for Insolvency while CoinFlex Files for Restructuring Ruholamin Haqshanas Last updated: June 26, 2023 06:54...


Discussion about this post